
Note
Go to the end to download the full example code.
Labelled image toolkit advanced examples#
Here we demonstrate some of the more advanced functions of the labelled toolkit, specifically at how space in a granular medium can be divided in different ways
Preparations as previous example#
import spam.mesh
import matplotlib.pyplot as plt
import spam.label
import spam.plotting
import scipy.ndimage
import spam.datasets
import numpy

im = spam.datasets.loadConcreteNe()
midSlice = im.shape[0] // 2
binary = numpy.logical_and(im > 28000, im < 40000)
cyl = spam.mesh.createCylindricalMask(im.shape, 40)
binary = numpy.logical_and(binary, cyl)
pores = scipy.ndimage.binary_dilation(im < 26000, iterations=1)
binary[pores] = 0
labelled = spam.label.ITKwatershed.watershed(binary)
print("{} particles have been identified".format(labelled.max()))
plt.figure()
plt.title("Labelled volume")
plt.imshow(labelled[midSlice], cmap=spam.label.randomCmap)
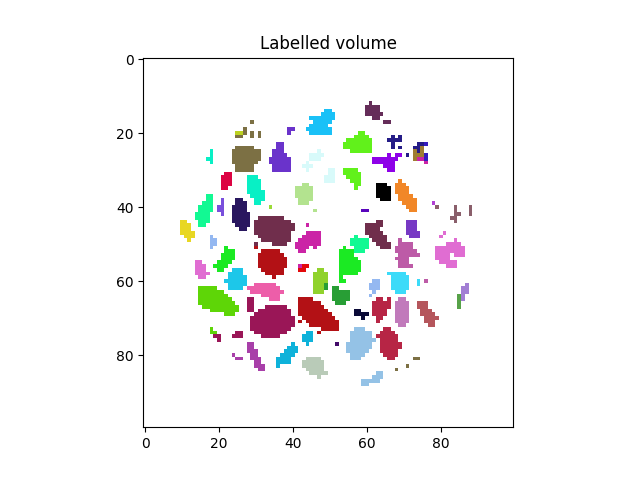
540 particles have been identified

<matplotlib.image.AxesImage object at 0x7f5851fade40>
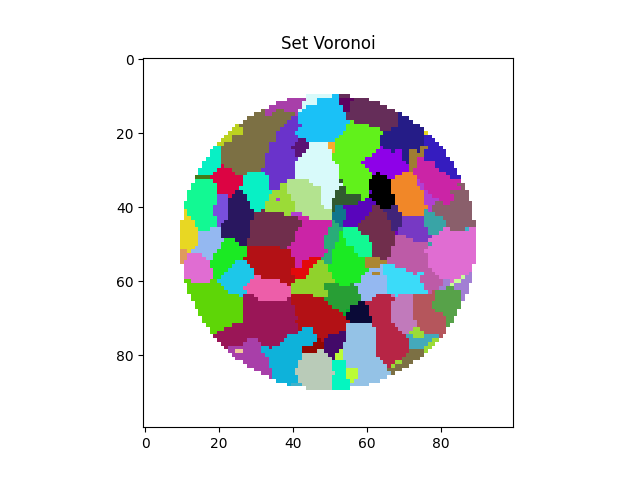
Label tookit: Make a Set Voronoi partition of the space#
Here we use an approximate algorith for the computation of the set voronoi as described in Schaller et al., (2013) Since we have a cylindrical limit, we will set the Set Voronoi to zero outside the cylinder
setVoronoi = spam.label.setVoronoi(labelled, maxPoreRadius=5)
setVoronoi[numpy.logical_not(cyl)] = 0
plt.figure()
plt.title("Set Voronoi")
plt.imshow(setVoronoi[midSlice], cmap=spam.label.randomCmap)
<matplotlib.image.AxesImage object at 0x7f5851ff9300>
If you compare the labelled volume above and the Set Voronoi you can see that they correspond – i.e., in the Set Voronoi labels are correctly propagated so that they fill the pores space.
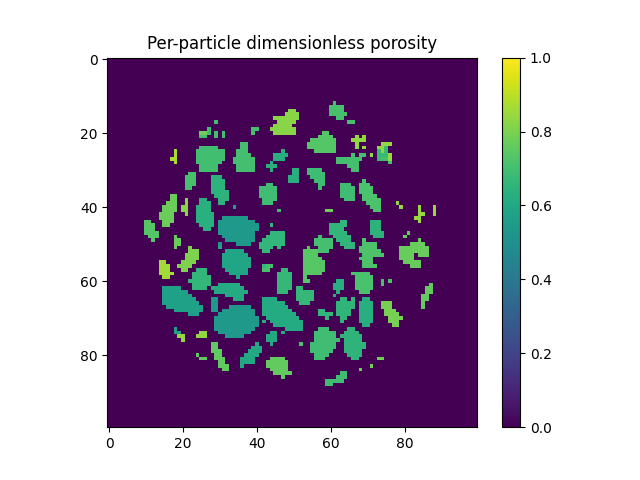
Local definition of porosity?#
This means that the pore space is assigned to each label, meaning that a per-particle porosity can be easily calculated:
particleVolumes = spam.label.volumes(labelled).astype('<f4')
setVoronoiVolumes = spam.label.volumes(setVoronoi).astype('<f4')
voidVolumes = setVoronoiVolumes - particleVolumes
porosities = voidVolumes / setVoronoiVolumes
voidRatio = voidVolumes / particleVolumes
As in the example in the previous example, we can show this by colouring particles:
plt.figure()
plt.title("Per-particle dimensionless porosity")
plt.imshow(spam.label.convertLabelToFloat(labelled, porosities)[midSlice], vmin=0.0, vmax=1.0)
plt.colorbar()
plt.show()
Now let’s try to plot the direction of the minimum eigenvector of these particles to orient them in space. This eigen vector points down the axis of a grain of rice
MOIval, MOIvec = spam.label.momentOfInertia(labelled)
# We'll plot from 1 onwards (0 not a valid label)
spam.plotting.plotOrientations(MOIvec[1:, 6:9], numberOfRings=4)
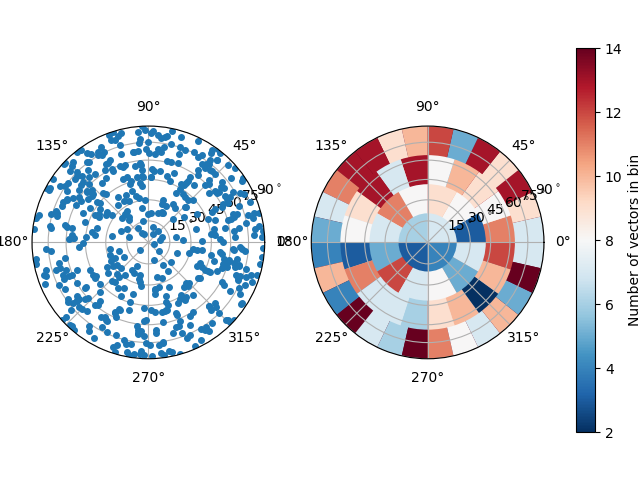
Perhaps we can detect a slight concentration of orientations close to horizontal, although there are few points…
Total running time of the script: (0 minutes 1.697 seconds)