
Note
Go to the end to download the full example code.
Read and write structured meshes#
This example shows how to read and write scalar and vector fields based on structured mesh (regular grid)
import spam.helpers
import spam.datasets
import matplotlib.pyplot as plt
import numpy
Import the structured fields#
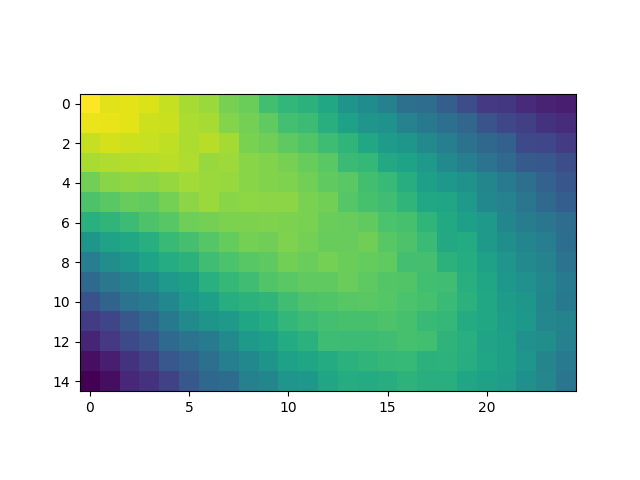
Import the scalar valued field
fields = spam.datasets.loadStructuredMesh()
scalarField = fields['scalarField']
# To be consistent with tifffile the first value refers to the z axis.
print("Scalar field dimensions: nz={} ny={} nx={}".format(*scalarField.shape))
halfSlice = scalarField.shape[0] // 2
plt.figure()
plt.imshow(scalarField[halfSlice, :, :])

Scalar field dimensions: nz=5 ny=15 nx=25

<matplotlib.image.AxesImage object at 0x7f5852c59d20>
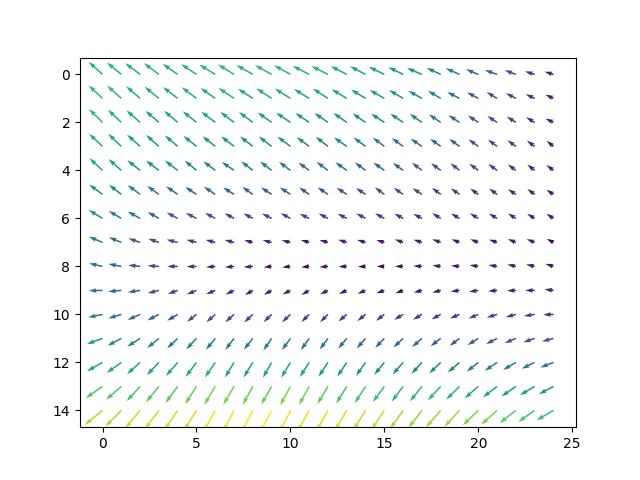
Import the vector valued field
vectorField = fields['vectorField']
print("Vector field dimensions: nz={} ny={} nx={}, vector: {}".format(*vectorField.shape))
plt.figure()
Y, X = numpy.mgrid[0:vectorField.shape[1], 0:vectorField.shape[2]]
U = vectorField[halfSlice, :, :, 1]
V = vectorField[halfSlice, :, :, 2]
plt.gca().invert_yaxis()
plt.quiver(X, Y, U, V, numpy.sqrt(U**2 + V**2))

Vector field dimensions: nz=5 ny=15 nx=25, vector: 3

<matplotlib.quiver.Quiver object at 0x7f5851aed990>
Save the fields into a single VTK#
Since voxels are elementary values (and not nodal) the VTK is saved with the
cellargument. The number of nodes (dimensions) is then the shape of the image + 1.
dimensions = (scalarField.shape[0] + 1, scalarField.shape[1] + 1, scalarField.shape[2] + 1)
print("Number of nodes:  {} x {} x {}".format(*dimensions))
# produce `fields.vtk`
spam.helpers.writeStructuredVTK(cellData={'myScalarField': scalarField, 'myVectorField': vectorField}, fileName="fields.vtk")
Number of nodes: 6 x 16 x 26
view first 20 lines of of the file fields.vtk
with open("fields.vtk") as f:
    for i in range(20):
        print("{:02}:\t{}".format(i + 1, f.readline().strip()))
01:     # vtk DataFile Version 2.0
02:     VTK file from spam: fields.vtk
03:     ASCII
04:
05:     DATASET STRUCTURED_POINTS
06:     DIMENSIONS 26 16 6
07:     ASPECT_RATIO 1.0 1.0 1.0
08:     ORIGIN 0.0 0.0 0.0
09:
10:     CELL_DATA 1875
11:
12:     SCALARS myScalarField float
13:     LOOKUP_TABLE default
14:     1.8824609518051147
15:     1.9046339988708496
16:     1.890101671218872
17:     1.9040473699569702
18:     1.9221075773239136
19:     1.8738933801651
20:     1.8770238161087036
Read the field from the VTK#
fieldRead = spam.helpers.readStructuredVTK("fields.vtk")
print("Size of the field: {}".format(len(fieldRead["myScalarField"])))
print("Sum of the differences between read and write : {}".format(numpy.sum(fieldRead["myScalarField"] - scalarField.ravel())))
Size of the field: 1875
Sum of the differences between read and write : 0.0
Reshape the fields into a 3D array#
scalarField3D = numpy.reshape(fieldRead["myScalarField"], scalarField.shape)
vectorField3D = numpy.reshape(fieldRead["myVectorField"], vectorField.shape)
plt.figure()
plt.imshow(scalarField3D[halfSlice, :, :])
plt.figure()
Y, X = numpy.mgrid[0:vectorField3D.shape[1], 0:vectorField3D.shape[2]]
U = vectorField3D[halfSlice, :, :, 1]
V = vectorField3D[halfSlice, :, :, 2]
plt.gca().invert_yaxis()
plt.quiver(X, Y, U, V, numpy.sqrt(U**2 + V**2))
plt.show()
Total running time of the script: (0 minutes 0.270 seconds)